AR3-GP wrote: ↑17 Sep 2026, 20:54
The other thing that's confusing me with the picture (
https://i.postimg.cc/pLSB8M89/image.png) is that it's not referenced to 0. Easy enough to offset, but still, it's also suggesting that Mercedes is somehow as much as 0.54% off the fastest car in the straights on a rolling basis. That doesn't add up to me. It's as if the plot says there is no consistently quick car on the straights even though each team has had the same PU all year and the active aero stuff has eliminated 99% of track specific wings. What would cause these fluctuations when we can assume that all teams use the full energy allocation across all of the straights (and thus track specific deployment differences have a very small role to play).
Will await the update.
I am a little bit of an early bird, so I tried a bunch of stuff today before heading off to work. There were quite a few problems to work around for 2026 in particular.
The biggest one is telemetry quality. In some races the speed channel is genuinely terrible. It has random freezes for hundreds of metres while the car is clearly braking or accelerating, then suddenly jump to catch up. China was particularly bad. Even one of those random "spasms" can move time from the corners into the straights or vice versa and produce rankings that made no sense when I looked at it closer. Particularly the gaps, which were completely unreasonable.
And in 2026 you can't really solve that by just cutting out the bad sections of track either, because deployment strategy matters. If one team happens to make a lot of its time on the straight you removed and another doesn't, you've biased the result. So I ended up taking the stricter approach. bad lap = discard the lap, and if too few teams have clean data, discard the race entirely. China, Suzuka, Canada and Barcelona didn't make the cut for example because it was full of these data inconsistencies.
I also changed the way the split itself is calculated. Corners are defined from the field as a whole. Flat-out stuff like 130R stay in the "straight" bucket, because I think it would not be fair to consider corners these sections where you keep building up speed while you turn or you don't lose speed at all. But in any case, you can also look into the per-race breakdown and look at the map and judge if the split between what is straight and what is corner makes sense. From what I saw, it's not bad. The only thing I would disagree with was Puohon being considered a straight, but that's a quirk of these 2026 cars. They turn corners into straights by superclipping so no brake is necessary. I didnt want to change the whole logic because of it, because in a way, it makes sense for them to be straights.
For each team I use the quicker driver's clean qualifying lap, or the team mate if the quicker lap is corrupted and the alternative is still within 1% of the team's best. Everything is then referenced to the fastest measured qualifying lap of that race, normally pole. That means 0 is an actual reference, and the straight + corner deltas add back up exactly to the total lap delta. And by doing it this way I go results that I am actually pretty happy with because it behaves the way you'd expect.
The ranking is not the same as the one you posted, but color me shocked, McLaren is actually not that bad on the straights when you look at it from a time spent on straights perspective. Across the usable races they lose only 0.31% of a lap on the straights to the reference, third best behind Mercedes at 0.00% and Red Bull (which for me was 2nd) at +0.24%.
Mercedes is also about where you'd expect this time. 0.00% on average, and even their worst race is only around 0.32% off on the straights. This was recorded in Hungary which makes sense from the telemetry as well where you see what it considers as straights are also short parts after critical traction zones between corners where you would expect McLaren to be very strong. Ferrari, meanwhile, is also interesting because they actually gain about 0.17% in the corners on average but lose around 0.54% on the straights, which gives roughly their +0.37% overall lap deficit. And it's also more in line with what you would expect considering their philosophy for the car this year. So the pecking order is generally preserved. On average across the season we have Mercedes->Ferrari>=McLaren>RedBull, although I expect this to change if McLaren continues like this.
Also, on your earlier point about Mercedes floating around ~0.5% despite supposedly being the reference, you were right that it didn't add up. The original methodology was effectively referencing straights and corners to different "best" cars and then averaging both drivers, so the pieces were never guaranteed to add up to the actual lap gap. That alone can inflate even the fastest team's average.
Here is the result I ended up with :
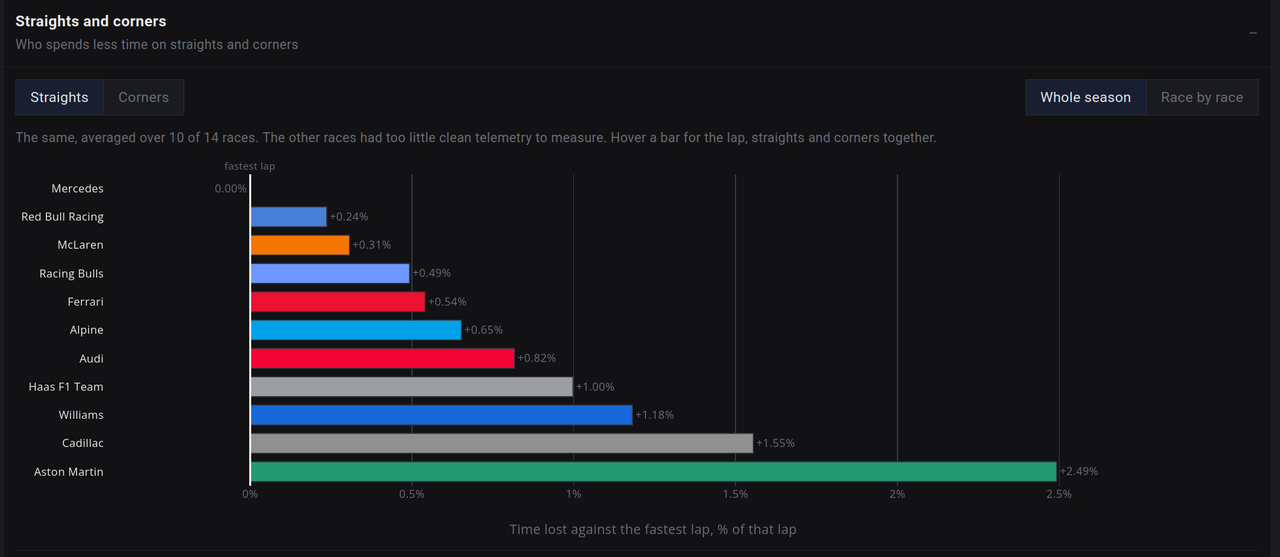
It's live on the website now :
https://f1insightshub.com/car_breakdown
Scroll to the bottom and expand corners & straights. You can go race by race and also read the methodology in detail.