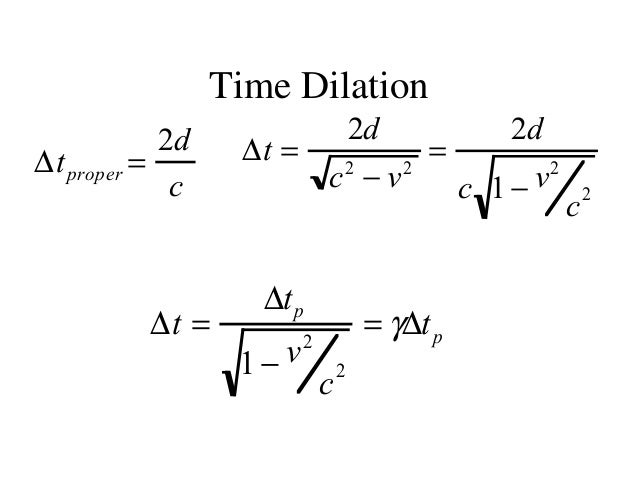
From special relativity, we know that time is slowest where speed is highest - I think. That's how we can observe time dilation between two object traveling at different speeds.
Graphically, they both essentially look like this...

...where the red line represents static pressure/time as a result of higher dynamic pressure/faster relative speed, and the blue lines depict the reason behind the difference.
Is there any connection here? And if so, what is it?
(I promise I'm not high. Yet.)

